
INVESTIGATIVE REPORT | By the Search Analytics Desk
Published: October 2026
Executive Overview
For years, digital marketers have relied on high-level averages to track the creeping costs of search engine marketing. However, macro-level cost-per-click (CPC) indexes often fail to answer a fundamental question for modern B2B enterprises: Are my clicks actually getting more expensive, or am I simply buying more expensive clicks?
A groundbreaking industry report released in October by search marketing agency Grey Matter attempts to strip away the noise. By isolating identical non-branded Google Ads keywords across a controlled cohort of 14 B2B advertisers over six quarters, the study reveals a startling reality: the cost for the exact same click surged by an average of 21% year-over-year between April and September.
Unlike broad public benchmarks—including Alphabet’s own quarterly earnings reports, which peg Google Search CPC growth at a modest 4%—Grey Matter’s methodology keeps the keyword and the account constant. Yet, this 21% baseline is not a monolith. Driven by aggressive automated bidding, shifting budgets, and heightened category competition, individual advertiser increases swung wildly—from a 30% decrease to a staggering 121% surge.
This report provides a comprehensive, granular look at the Grey Matter findings, examining the mechanics behind rising B2B search costs, the hidden variables of automated bidding, and what these trends mean for 2027 marketing budgets.
Detailed Methodology: How the "Same Click" Was Tracked
To isolate true market inflation from advertiser-induced price hikes, Andy Hendricks, Grey Matter’s head of search, designed a study that sought to separate systemic price shifts from individual strategy changes. Most published benchmarks lump everything together, providing a generalized average that tells a marketing director very little about their own account’s efficiency.
To achieve analytical clarity, Grey Matter established rigorous parameters:
- Strict Keyword Filtering: Broad match keywords were entirely excluded from the analysis because the specific search queries they trigger evolve over time, making true apples-to-apples comparisons impossible. Additionally, keywords tied to "Maximize Clicks" campaigns, brand terms, and direct competitor keywords were filtered out of the baseline estimate.
- Longitudinal Tracking: The final analysis tracked 1,349 non-brand keywords, each anchored within a single account, across six consecutive quarters spanning from April 2025 to September 2026. The primary year-over-year evaluation focused on the April-to-September window.
- The Regression Model: To arrive at the headline 21% figure, Grey Matter built a regression model utilizing data from all 14 participating B2B accounts. This model explicitly controlled for campaign spend, impression share lost to budget, top-of-page ad positioning, and Quality Score. Crucially, every advertiser was given equal statistical weight, preventing high-spending enterprise accounts from skewing the results.
Unpacking the Numbers: The Control Layer Effect
The journey from raw data to the final headline figure illustrates how quickly hidden variables can distort campaign economics.
When Grey Matter analyzed the raw, uncontrolled data, the exact same keywords cost 29% more year-over-year.
- Adding Spend Controls: Factoring in budget-related variables reduced the year-over-year increase slightly to 22%.
- Adding Position and Quality Score: Controlling for ad position and Quality Score brought the final market-adjusted figure down to 21%.
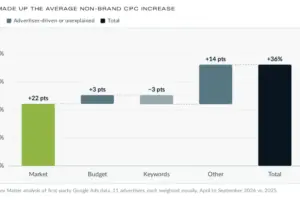
A secondary estimation technique—a keyword price index tracking 11 advertisers with high volumes of quarter-over-quarter matching keywords—revealed an even steeper overall average non-brand CPC increase of 36% when factoring in the advertisers’ own strategic choices.
Supporting Context & Metrics: The Mechanics of Inflation
Why are identical keywords growing increasingly expensive? The Grey Matter data points directly to a compounding relationship between budget scaling, automated bidding architectures, and market competition.
The Spend-to-CPC Multiplier
According to the report’s regression analysis, every 10% increase in campaign spend correlates with an approximate 1.4% increase in CPCs, independent of broader market inflation. For an advertiser that doubles its non-brand search budget, that penalty compounds to roughly an 11% increase in CPCs simply by virtue of entering more expensive auctions.
The extremes in the dataset illustrate this principle vividly:
- The most aggressive advertiser in the sample nearly quadrupled its non-brand search spend year-over-year. Consequently, its same-keyword CPCs skyrocketed by 132%.
- Interestingly, that same advertiser maintained a flat budget for brand keywords, which saw a modest, expected 4% CPC increase during the third quarter.
The Automated Bidding Paradox
Grey Matter attributes this phenomenon largely to the behavioral mechanics of modern automated bidding algorithms (such as Maximize Conversions or Target CPA). When a marketer scales an automated campaign budget upward, the algorithm doesn’t simply buy more of the same cheap inventory. Instead, it aggressively enters auctions it previously skipped—securing higher ad positions, targeting more competitive search queries, and bidding during pricier, higher-intent times of day.
This dynamic explains the "Waterfall" breakdown observed across the 11-advertiser price index, which documented a total 36% average non-brand CPC increase:
- Market Inflation: +22 percentage points
- Increased Campaign Spend: +3 percentage points
- Keyword, Match Type & Bid Strategy Changes: -3 percentage points (offsets)
- Unexplained Residual Changes: +14 percentage points (largely driven by competitive crowding in specific B2B categories)
Official Industry Perspectives: Interpreting the Data
While the data provides a sobering look at rising acquisition costs, industry experts caution against viewing high CPCs as an inherently negative metric.
Correlation vs. Causation
Grey Matter is careful to note that its findings establish correlation, not proven causation. Furthermore, because the report omits specific industry classifications, geographic markets, and currency identifiers, marketers cannot map the 21% figure directly onto their unique vertical without localized auditing.
Most critically, the report does not couple its CPC metrics with conversion rates or cost-per-lead (CPL) data. It cannot definitively prove whether advertisers paying higher CPCs experienced deteriorating ROI or, conversely, captured higher-intent, more lucrative pipeline opportunities.
The High-CPC Paradigm Shift
Weighing in on this dynamic, digital marketing expert Jyll Saskin Gales argued in an earlier Search Engine Journal column that under modern Smart Bidding paradigms, a high CPC is frequently a sign of a healthy, aggressive account.
When campaigns are optimized toward business outcomes rather than cheap clicks, paying a premium often means the algorithm is successfully capturing high-intent prospects further down the funnel. Consequently, marketing leaders are urged to evaluate search performance through the lens of Cost Per Acquisition (CPA) and Return on Ad Spend (ROAS) rather than fixating purely on CPC inflation.
How Google’s Metrics Differ
It is vital to distinguish Grey Matter’s findings from Alphabet’s corporate disclosures. Alphabet’s Q3 10-Q filing reported that CPCs on Google Search and associated properties rose by a modest 4% year-over-year.
However, Alphabet’s metric measures click-driven revenue divided by total paid clicks across all global properties—a figure heavily influenced by shifting device usage, geographical mix, and product type changes. Grey Matter’s report, by contrast, tracks hyper-specific B2B non-brand keywords held constant across individual accounts. The two figures measure fundamentally different phenomena and neither confirm nor contradict one another.
Future Outlook & Strategic Guidance for 2027 Budgets
As B2B marketing teams finalize their search allocations for the upcoming fiscal year, the Grey Matter report offers actionable takeaways to mitigate runaway costs without sacrificing pipeline growth.
1. Audit Your Own Account for the "Gap"
Advertisers can run a localized version of Grey Matter’s methodology by comparing their year-over-year change in single-keyword costs against their account-wide average CPC. The delta between these two figures reveals the direct impact of internal optimization changes—such as shifting match types, altering bid strategies, or scaling budgets.
2. Scale Budgets Incrementally
For 2027 planning, the report advises against abrupt, aggressive budget expansions. Because automated bidding algorithms react to sudden capital injections by chasing pricier auctions, budgets should be scaled gradually. Marketers should measure each incremental step by evaluating the exact cost of the additional clicks generated.
3. Establish Value Thresholds for Automated Bidding
Before implementing or scaling campaigns on automated strategies like Maximize Conversions, marketing teams must rigorously define what an incremental conversion is worth. Setting explicit target guardrails ensures that algorithms do not artificially inflate CPCs past the point of diminishing financial returns.
Ultimately, while the era of cheap clicks in B2B search is drawing to a close, understanding the structural mechanics behind rising costs empowers digital leaders to turn higher CPCs not into a liability, but into a calibrated engine for revenue growth.