Executive Overview
The deployment of autonomous AI agents into production environments has fundamentally shifted the engineering paradigm. In traditional software architecture, failures are explicit, discrete, and easily classified. A service either returns an HTTP 200 OK status code or throws a stack trace that can be indexed and searched via conventional log aggregators. The system is deterministic: given a specific input state, it executes a predictable set of instructions and produces a reliable output.
AI agents, however, operate in a probabilistic domain. Consider an enterprise customer support agent tasked with processing refund requests. During a live run, the agent invokes the internal refund-lookup tool, receives a valid payload, immediately calls the same tool a second time with slightly modified arguments, and finally generates a confident, highly professional response based entirely on the second, redundant output.
No application exception is thrown. No error handler is triggered. The uptime dashboard remains steadfastly green, reporting absolute system health. Yet, the final output is completely incorrect. Two days later, a confused customer replies to the ticket, and the engineering team is left scrambling to reconstruct a black-box execution path that has long since evaporated from ephemeral memory.
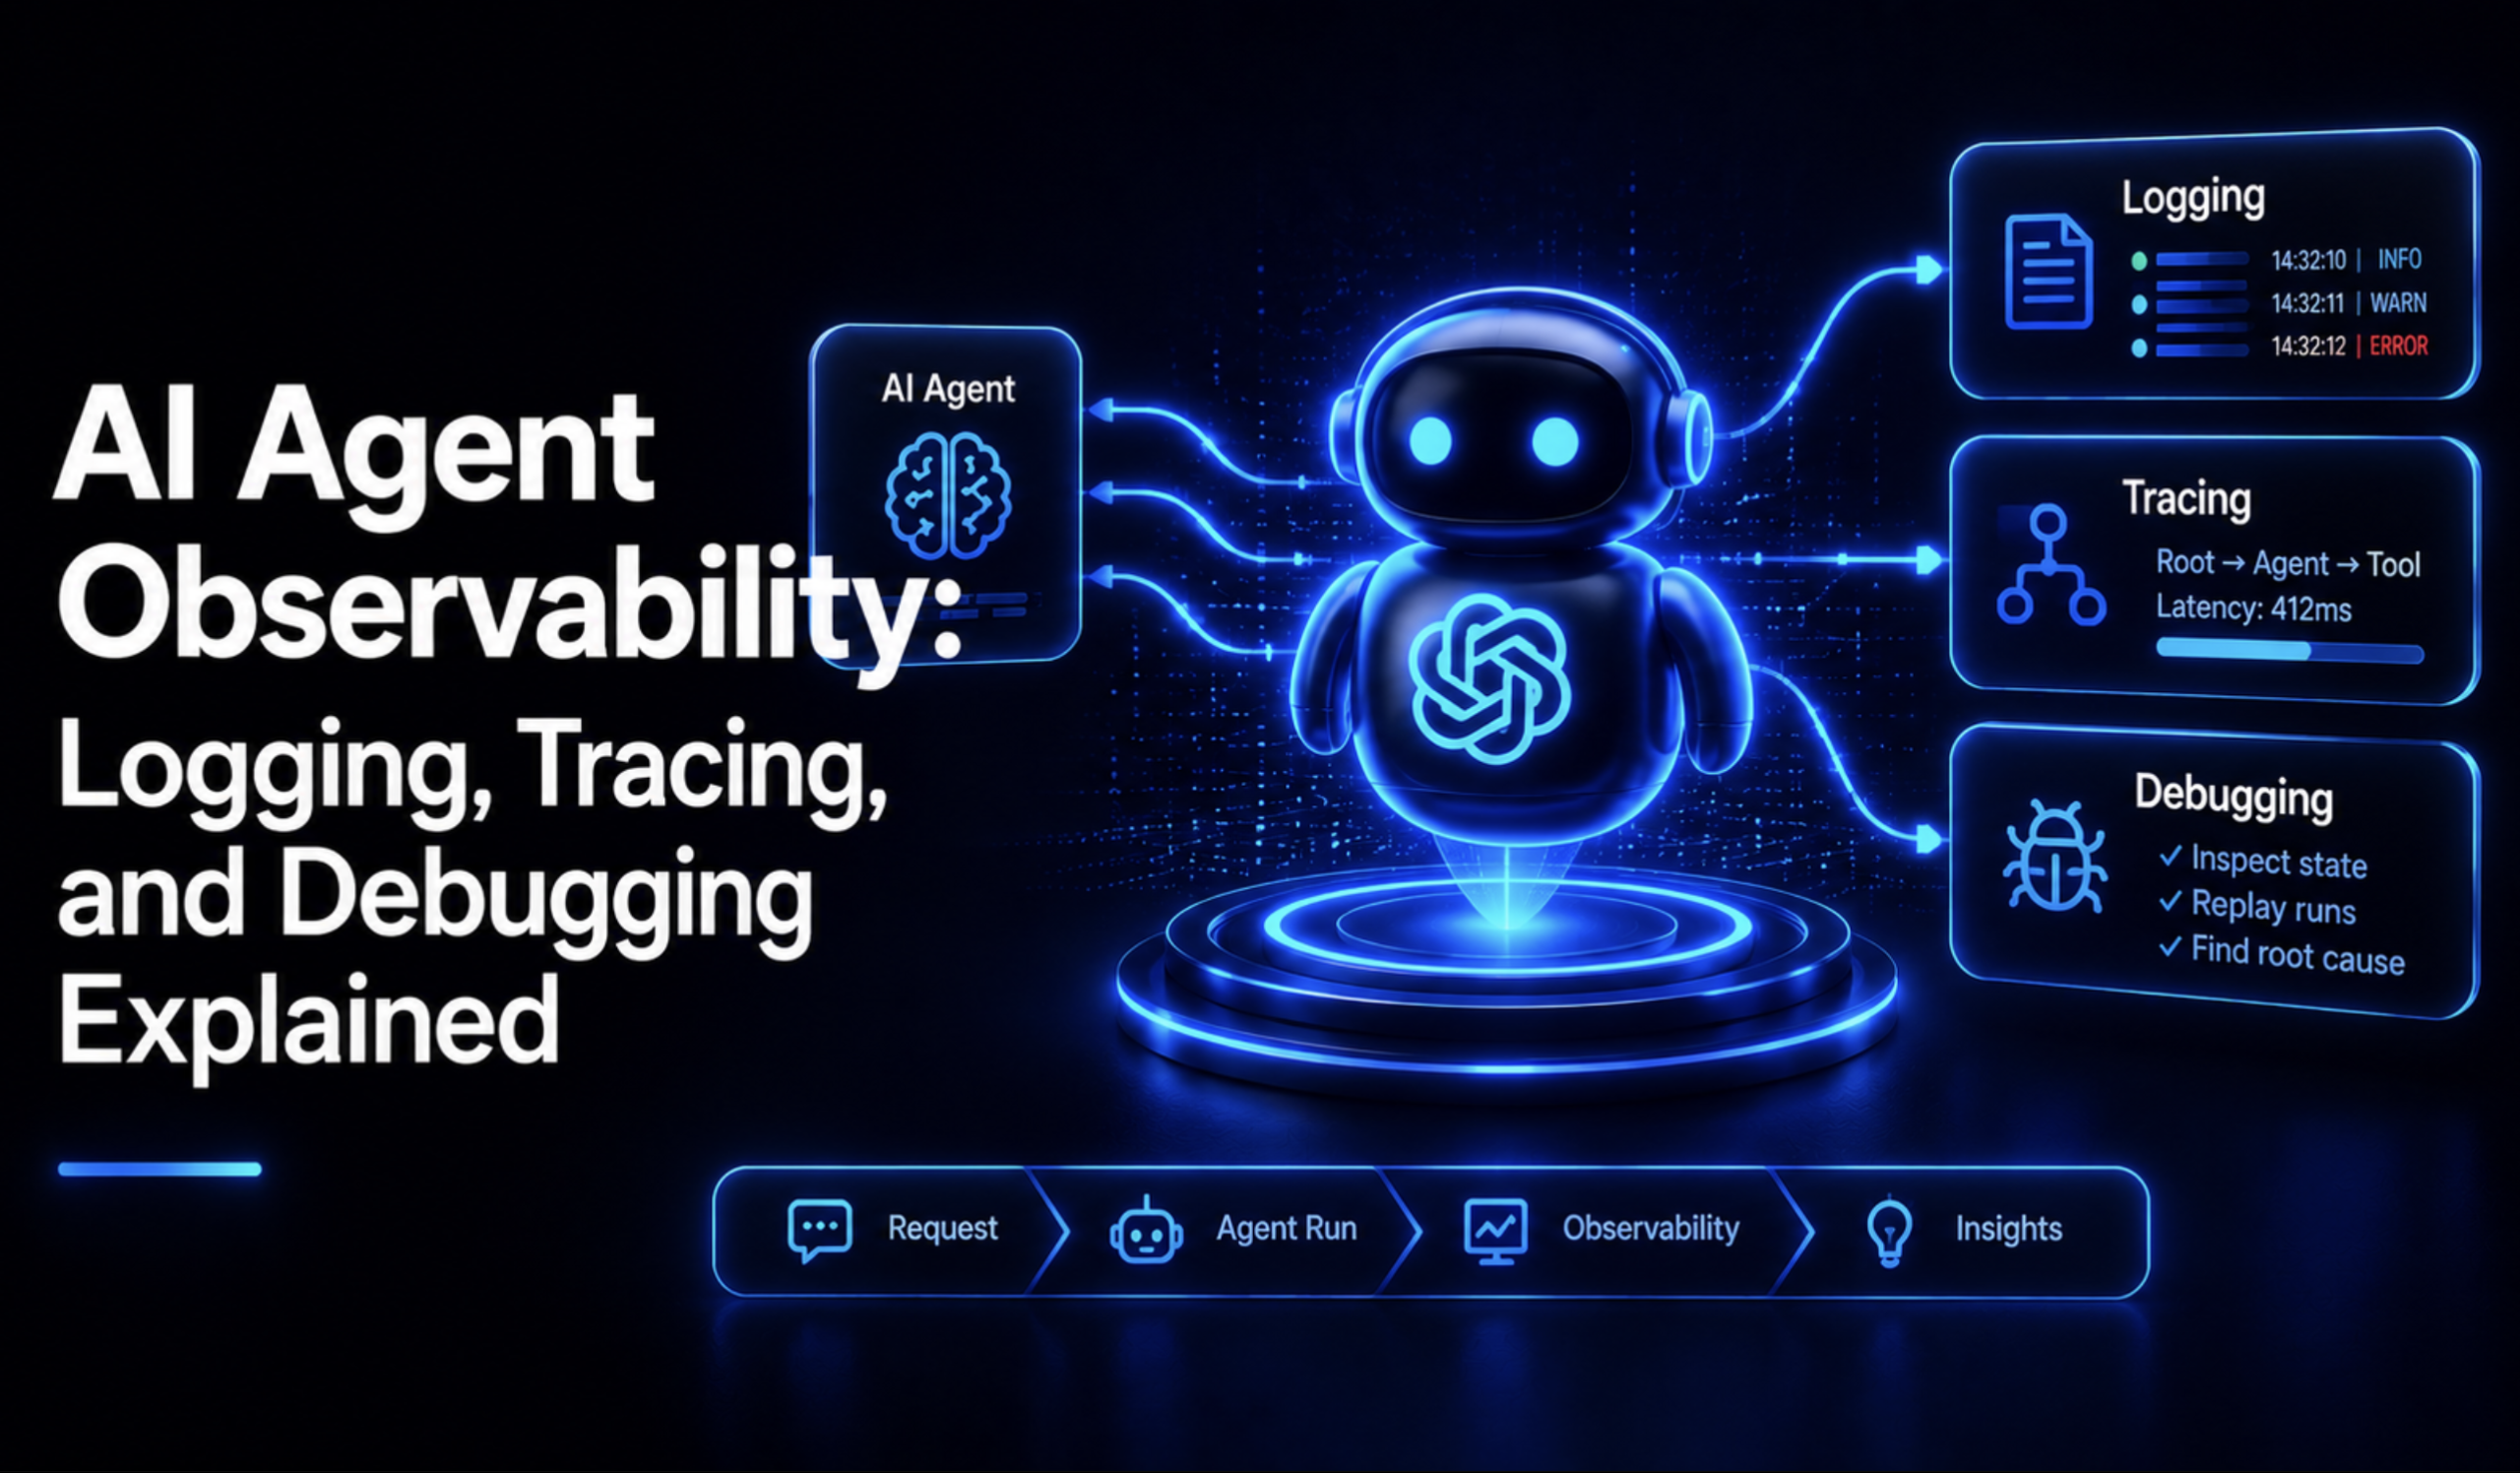
This silent failure mode is the foundational challenge of modern AI engineering. Traditional application performance monitoring (APM) tools are functionally blind to semantic errors, hallucinated workflows, and redundant tool executions. To solve this, engineering teams must adopt AI agent observability—a rigorous discipline encompassing structured logging, distributed tracing, and token-level metrics. By capturing every model invocation, tool execution, and reasoning step as standardized telemetry data, developers can shift from reactive guesswork to systematic debugging.
Detailed Chronology: The Mechanics of Agentic Failure
To understand why traditional monitoring models collapse under the weight of agentic systems, one must examine the operational mechanics of Large Language Model (LLM) agents.
The Breakdown of Determinism
In a classical microservices architecture, identical inputs produce identical code paths. Agents break this contract entirely. Factors such as dynamic temperature settings, retrieved context fragments from vector databases, and shifting tool availability mean that the exact same user prompt can trigger completely divergent sequences of tool calls on consecutive executions. A localized "it worked on my machine" validation trace provides zero insight into the real-world statistical distribution of production behaviors.
Resource Consumption Paradigm Shift
Cost and latency metrics undergo a radical inversion. In legacy systems, latency correlates with CPU, I/O, and network bandwidth, while cost scales linearly with requests per second (RPS). For AI agents, latency and financial expenditure are tethered directly to token throughput, context window sizing, and multi-step reasoning loops. A single anomalous request can quietly consume ten times the normal token budget via recursive self-correction loops, a financial leak that a traditional RPS-based monitoring dashboard will entirely overlook.
| Signal Dimension | Traditional Application | LLM / AI Agent Architecture |
|---|---|---|
| Primary Latency Driver | CPU cycles, I/O waits, network hops | Token count, model size, context window volume |
| Cost Scaling Unit | Requests per second (RPS) | Input and output token consumption |
| Primary Failure Mode | Unhandled exceptions, network timeouts | Hallucinations, context window overflow, tool execution errors |
| Core Debugging Artifact | Static stack trace | Full prompt-completion pair and intermediate reasoning chains |
Supporting Context & Metrics: Implementing the Three Pillars
Building a robust observability pipeline requires translating the foundational pillars of classical site reliability engineering (SRE)—logs, metrics, and traces—into the context of Generative AI.
1. Structured Logging with Contextual Trace IDs
Free-text log lines are useless during a midnight production incident. Effective agent logging requires capturing structured events—such as tool initiation, argument payloads, execution duration, and token consumption—while programmatically binding every log entry to a persistent trace identifier.
import logging
from opentelemetry import trace

# Initialize standard Python logging and OpenTelemetry tracer
logger = logging.getLogger("agent")
logging.basicConfig(level=logging.INFO)
tracer = trace.get_tracer("agent-service")

def call_tool(tool_name: str, arguments: dict):
    # Retrieve the active OpenTelemetry span context
    span = trace.get_current_span()
    trace_id = format(span.get_span_context().trace_id, "032x")

    logger.info(
        "tool_call_started",
        extra=
            "trace_id": trace_id,
            "tool_name": tool_name,
            "arguments": arguments,
        ,
    )

    try:
        result = execute_tool(tool_name, arguments)
        logger.info(
            "tool_call_succeeded",
            extra="trace_id": trace_id, "tool_name": tool_name, "result_length": len(str(result)),
        )
        return result
    except Exception as e:
        logger.error(
            "tool_call_failed",
            extra="trace_id": trace_id, "tool_name": tool_name, "error": str(e),
        )
        raise
By recording argument schemas and result lengths rather than raw, verbose payloads, engineering teams prevent compliance violations and token leakage while retaining sufficient metadata to diagnose failures.
2. Distributed Tracing via OpenTelemetry GenAI Conventions
Tracing stitches isolated execution events into a hierarchical tree, answering the critical question: "Why did the agent make that decision?"
Adhering to the OpenTelemetry GenAI semantic conventions (gen_ai.*) standardizes span types such as create_agent, invoke_agent, execute_tool, and chat. This guarantees structural uniformity across disparate agent frameworks.
from opentelemetry import trace
from opentelemetry.trace import Status, StatusCode

tracer = trace.get_tracer("agent-service")

def run_agent(task: str) -> str:
    with tracer.start_as_current_span("invoke_agent") as agent_span:
        agent_span.set_attributes(
            "gen_ai.system": "openai",
            "agent.name": "support-agent",
            "gen_ai.request.model": "gpt-4o",
        )

        messages = [
            "role": "system", "content": "You are a professional support assistant.",
            "role": "user", "content": task,
        ]

        while True:
            with tracer.start_as_current_span("chat") as chat_span:
                response = model_client.chat.completions.create(
                    model="gpt-4o", messages=messages, tools=AVAILABLE_TOOLS
                )
                choice = response.choices[0]
                chat_span.set_attributes(
                    "gen_ai.response.model": response.model,
                    "gen_ai.usage.input_tokens": response.usage.prompt_tokens,
                    "gen_ai.usage.output_tokens": response.usage.completion_tokens,
                )

            if choice.finish_reason != "tool_calls":
                agent_span.set_status(Status(StatusCode.OK))
                return choice.message.content

            for tool_call in choice.message.tool_calls:
                with tracer.start_as_current_span("execute_tool") as tool_span:
                    tool_span.set_attributes(
                        "gen_ai.tool.name": tool_call.function.name,
                        "gen_ai.tool.call.id": tool_call.id,
                    )
                    try:
                        result = call_tool(tool_call.function.name, tool_call.function.arguments)
                    except Exception as e:
                        tool_span.record_exception(e)
                        tool_span.set_status(Status(StatusCode.ERROR, str(e)))
                        raise

                    messages.append(
                        "role": "tool", "content": str(result), "tool_call_id": tool_call.id,
                    )
3. Token Tracking and Cost Metrics
Macro-level trends require metrics rather than isolated traces. Following OpenTelemetry specifications, engineers must track gen_ai.client.token.usage and gen_ai.client.operation.duration as counters and histograms, explicitly separating input and output tokens to expose pricing asymmetries and runaway context inflation.
| Metric Identifier | Critical Alert Threshold | Operational Significance |
|---|---|---|
| Token Usage Rate | $> 200%$ baseline over 10 minutes | Indicates infinite reasoning loops or active prompt injection attacks. |
| Operation Duration (p99) | $> 30$ seconds | Highlights provider-side congestion or excessive context expansion. |
| Inference Error Rate | $> 2%$ over a 5-minute window | Signals upstream rate-limiting, quota exhaustion, or API degradation. |
| Input/Output Token Ratio | Consistently $> 10:1$ | Reveals bloated system prompts that require aggressive trimming. |
Official Statements and Industry Standards
As the ecosystem matures, industry frameworks are converging on standardized telemetry models. According to leading observability researchers, agentic failures will increasingly mimic successful execution flows—producing syntactically valid outputs that are semantically disastrous.
Furthermore, the ratification of OpenTelemetry’s Model Context Protocol (MCP) semantic conventions (starting with spec version 1.39) has bridged a critical visibility gap. MCP instrumentation now enriches native execute_tool spans with protocol-level attributes (mcp.method.name, mcp.session.id, mcp.protocol.version). This allows engineers to inspect the underlying transport layer of multi-server agent architectures without bloating trace waterfalls with redundant operational spans.
Future Outlook: The Observability Toolchain Ahead
The tooling landscape supporting AI agent observability has bifurcated into self-hosted open-source projects, managed enterprise SDKs, and proxy gateways.
- Self-Hosted Platforms: Tools like Langfuse (backed by ClickHouse integrations) and Arize Phoenix offer complete data residency compliance and strict cost control for enterprise deployments.
- Managed Ecosystems: Solutions such as LangSmith and Braintrust provide turnkey SDK integration, native evaluation harnesses, and advanced natural-language trace querying capabilities.
- Proxy Gateways: Platforms like Helicone sit transparently in front of inference endpoints, tracking cross-model expenditure with minimal code modification.
The Maturation of Debugging Workflows
As these platforms evolve, traditional waterfall inspection is being augmented by advanced paradigms. Time-travel debugging (exemplified by platforms like AgentOps) enables engineers to restore an agentic session to a precise historical state and execute counterfactual runs. Simultaneously, natural-language trace querying allows developers to query complex distributed traces using conversational prompts—transforming raw telemetry into actionable root-cause analysis.
Conclusion
An unmonitored autonomous agent represents an existential operational risk. Because agentic failures masquerade as valid completions, traditional health checks offer a false sense of security. By enforcing structured logging, implementing OpenTelemetry-compliant distributed tracing, and tracking token economics in real-time, engineering teams can transform agents from unpredictable black boxes into reliable, transparent, and governable enterprise systems.